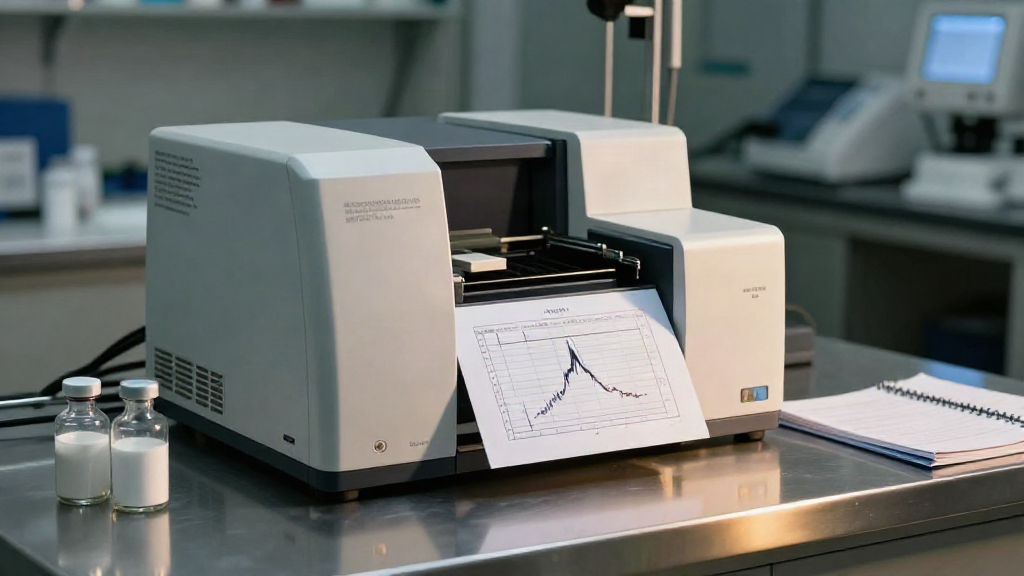
How to Read an HPLC Chromatogram for Research Peptide Analysis
An HPLC chromatogram is the primary record of a separations run. It is a plot of detector response against time, and it is read in a fixed order: identify the axes, locate each peak, note its retention time, measure its area, then judge the separation quality around it.
This guide is a method-level walkthrough. It covers what each element of a chromatogram represents, how those readings are recorded in a laboratory notebook, and the integration and baseline problems analysts flag when documenting a run.
What an HPLC Chromatogram Actually Shows
High-performance liquid chromatography separates components of a dissolved sample as they travel through a column under pressure. Each component reaches the detector at a different moment because it interacts with the stationary phase differently.
The detector records a signal only when material passes through its flow cell. The chromatogram is that signal plotted over the course of the run. A peak is not the compound itself. It is the detector's response to that compound at a particular point in time.
For research peptides, most documentation centers on reverse-phase separations with UV detection. A lyophilized powder is dissolved, introduced to the system, and the resulting trace is retained as a record of the run's conditions and outcome.
The Axes, in Plain Terms
The horizontal axis is time, expressed in minutes. It begins when the injection is made or when acquisition starts. Everything downstream is anchored to this axis.
The vertical axis is signal intensity, expressed in arbitrary units such as absorbance units or millivolts, depending on the detector. The value is not meaningful on its own. It becomes meaningful only relative to the baseline, the flat region where no analyte is passing the detector.
Read the axes before reading anything else. Acquisition time, detector wavelength, and the signal scale all belong in the run record, because a peak's appearance depends on them.
Retention Time: When a Peak Elutes
Retention time is the interval between injection and the apex of a peak. It is the most common identifier recorded from a chromatogram, and it is reproducible only when the method is held constant.
Retention time shifts when the mobile phase composition changes, when the column temperature drifts, when flow rate moves, or as a column ages. This is why a retention time is documented next to the exact conditions that produced it, not stored alone.
Analysts use retention time for correlation, not confirmation. A match supports the premise that the same run conditions produced the same elution behavior. It does not, by itself, establish identity.
Peak Area, Peak Height, and What They Describe
Peak area is the integrated region under the peak, bounded by the baseline. Peak height is the distance from the baseline to the apex. Area is the more robust of the two because it is less sensitive to peak broadening.
Both values are relative measurements. The detector's response factors differ between compounds, so an area is compared against a reference run recorded under the same method, not against an absolute standard.
This is also where documentation language matters. Reporting a relative area or a percentage composition from an integration is a statement about the trace. Reporting a purity figure as if it were a property of the vial is a different kind of claim, and the difference belongs in the notebook.
Resolution and Peak Shape
Resolution describes how well two adjacent peaks are separated. It is calculated from the distance between the two apexes relative to the widths of the peaks at the baseline. Higher resolution means less overlap and a cleaner integration boundary.
Peak shape carries information of its own:
- Symmetrical peaks suggest the separation behaved as the method intended.
- Tailing peaks often point to secondary interactions with the stationary phase, an overloaded column, or an unsuitable mobile phase.
- Fronting peaks can indicate sample solvent mismatch or column deterioration.
- Splitting or shoulders suggest coelution, meaning two components eluted close enough to merge.
Record the observation, not an interpretation. "Peak tailing observed; symmetry factor noted" is a defensible notebook entry. "Impurity present" is a conclusion that a single trace cannot support.
Integration and Baseline: The Step That Causes Most Disagreement
Integration is the process of assigning areas to peaks. It is a decision, and different analysts can reach different numbers from the same file if the baseline is drawn differently.
Watch for four recurring problems:
- Baseline drift. A sloping baseline inflates the area of early peaks and deflates late ones. Correct the drift before integrating, and note that you did.
- Unresolved shoulders. Forcing a valley-to-valley split between peaks that never return to baseline produces areas that look precise but are arbitrary.
- Solvent front and injection artifacts. The first disturbance after injection is usually system-related. It should be identified as such rather than integrated as a peak of interest.
- Overload. When a peak flattens at the top, the detector has saturated. The area under a plateau is not linear with the amount injected.
Every one of these should be described in the record. A chromatogram without notes on how it was integrated is only half a document.
Recording a Chromatogram in the Laboratory Notebook
A complete entry typically includes:
- Sample and lot identifier, so the trace is traceable to a specific vial.
- Method reference: column, dimensions, particle size, mobile phase, gradient or isocratic program, flow rate, detection wavelength, injection volume, and run time.
- Injection sequence and any blanks or system suitability runs.
- Retention time, area, height, and calculated resolution for each peak of interest.
- Baseline and integration decisions, including any manual adjustments.
- Storage conditions of the sample before analysis, such as reconstitution details and holding temperature.
The point of the list is reproducibility. A second analyst should be able to read the entry and understand exactly what was done and what was observed.
Pitfalls Analysts Flag When Documenting
Three habits weaken a chromatogram record more than any instrument fault.
First, over-reading the trace. A chromatogram describes elution behavior under one method. Extending that to claims about identity or composition beyond the run's scope is not supported by the data.
Second, omitting method detail. A retention time without conditions is not comparable to anything, including a previous run in the same laboratory.
Third, skipping change control. If the gradient was shortened or the wavelength changed mid-study, that belongs in the record. Silent method drift is the most common reason two chromatograms from the same sample fail to agree.
Frequently Asked Questions
What is the difference between retention time and peak area? Retention time indicates when a component eluted. Peak area indicates how much detector response occurred during that elution. They answer different questions and are recorded separately.
How many injections should a record include? Enough to establish repeatability under the method, plus system suitability runs where the method requires them. The count and the reasoning belong in the notebook.
Can a chromatogram be interpreted without the method conditions? No. The trace is only readable alongside the conditions that produced it.
Conclusion
Reading an HPLC chromatogram is a sequence, not a single act of interpretation: axes, peaks, retention time, area, resolution, then the integration decisions behind every number. Done carefully and documented fully, a chromatogram becomes a reproducible record of a separations run rather than a picture of one.
For laboratory research use only. Not for human or animal consumption. Not a drug, food, or supplement.